
This idea was one that popped into my head at about 3am. After George, my 2 year old son, woke us and I had settled him again, I began thinking about Google forms (as you do at 3am – what better time to be thinking about that subject!!) and the current work we are doing on film narrative and The Piano by Aidan Gibbons. Take a look at the film for yourselves.
What is an emotion graph?
An emotion graph is a simple line graph comparing a range of happiness to sadness against different points (time) in a story or film. This technique of graphing the emotional ups and down within a story really helps children to visualise the whole story in a different way. Once the graphs are complete they can be discussed in reference to the different peaks and troughs of emotion. “Why is the main protagonist so upset at this point on the graph, what has happened?”, “In which part of the story is he the happiest?”
The graph can reflect the events in any type of linear narrative, whether that be a book or film – it could even reflect the varying emotions within an event such as a football match.
As you can see the whole plot in one graph it is useful to engage the children in conversations about the structure of the plot and the way that the emotions are tied into generic story elements such as problems, conflicts and resolutions.
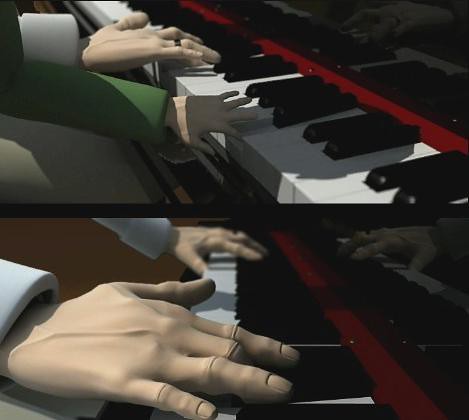
The children in my class really enjoyed watching The Piano today as we began our film narrative unit. One of the children said that the main character was playing his emotions on the piano, they were the notes of his life. Such a lovely turn of phrase. The Piano is an excellent text to explore in terms of an emotional graph as each of his memories linger, bringing joy and sadness into his life again.
Step by Step – make the form
- Create a new Google form
- Add a new question for each of the different events that you would like to gauge the emotions for. Because the film is only two and half minutes long I have chosen about ten or eleven events.
- Select “Choose from a Scale” question type and add the numbers 0 – 10. For each question, I added a reminder about the emotional scale from sad (0) to joyous (10) as some additional text. I found it really easy to generate one question and then just duplicate it using the link, and just edit what the event is.
Step by Step – create the emotion graph
Your form is complete and now you just need to add the line graph itself to the linked spreadsheet. You will see in your spreadsheet that the header (top) row is filled in with the different events from left to right.
- Under each column heading add the average =AVERAGE(Range) formula for the cells below, say down to 100 cells below. This will average out the different responses from your form and return a single figure. Don’t worry the survey results should always be added below your average row. I like to add the “Rounded” formatting to these cells as well.
- Select these average figures
- Click the “Insert Chart” tool and create a line graph from this data. (These average cells could also be hidden, select the row from the left and click hide row) Find some more detailed steps to making a chart here.
- Place the chart to the right of your data or embed within a blog post somewhere, and enlarge it so that it is clearly visible.
I will be emailing the emotion graphing form to all of our Year 5s and getting them to complete the form (from within the email) alongside watching the film again. We will then be reviewing the responses and how the emotions vary throughout the text. I will be encouraging them to justify their responses and decisions with supporting evidence from the film.
Now it is your turn to complete the emotion graphing survey that I have referred to – watch the film again, if you haven’t already, and answer the survey. The code for embedding a form is available when you click “Edit/Resend Form” and then it is under the “Preview and Send” link.

You will see that I have published the graph which can be done from within the graph drop down menu.
Let me know what you make of this idea and whether it was worth a sleepless early morning!
- How can you use this idea in your own narrative or literacy unit?
- Have you used emotion graphs? (I know there is an option with Turning Point voting systems to do something similar which I have used in the past)
- How have you used them?
- How else have you used Google forms in the classroom?
Where’s the code for the numbers used to convey emotions in the graph? What’s a 0? What’s a 10?
Hey Tom,
If you took each frame and got the kids to grade it against 2 emotions scales, say Miserable – Ecstatic, Boring – Excited, you could then use that motion graph that Ronald Ho showed us at GTAUK…
Great idea – will use it later on this year with my GCSE history class. 🙂
Inspiring Tom. You are a clever old boot. The thing I like most is how much I imagine the children will enjoy filling out the form as a means of responding to the film; that their reaction and thought contribute to something. That’s a big thing.
Thank you for this useful post. I am thinking of using this lesson to teach emotions and moods in Frenc/Spanish as I am an MFL teacher. It should be more inspiring than the usual flashcard/powerpoint lesson!
What a wonderful way to use Google Forms, I never realised it’s huge potential for assessment. I am eager to use this as a tool for developing comprehension in readers. As you said this allows children to visualise and structure a story in a new way. Thank you.
I absolutely love The Piano. I have shown it to teachers in a number of workshops and in a few I even got teary in front of everyone which was quite embarrasing 🙂 This is a brilliant way to use this video in conjunction with Google Docs. I’ll be highlighting this post to teachers I work with since I don’t have a class now to try it out with myself.
Nice Lesson on so many levels.
I use a similar strategy with 3/4/5/& 6 to track tension and excitement in a narrative. It’s a nice way to look at major and minor complications as well as descriptive passages that set the scene, climax etc, etc
cheers
Adrian
Great idea – wiould be really interesting to see if this sort of thing could be shared across several schools to compare graphs. It would be great for discussion if the trends seemed to be different for different classes.
Good effort!
About the Piano, and not Google forms (am I off topic?).
We have just finished work on this…actually could have gone on for ages, but only had three weeks.
We got so much out of it..technology wise used VoiceThread to capture emotions (screengrabs, not video) and PhotoStory and PowerPoint for their own writing.
A couple of the children blogged about it (Leia, Fraser and Connor at shepeaustow.net). One interesting thing…if you search YouTube the versions of the animation all have a different soundtrack and we guessed the original because the notes that the man plays are musically correct in the YouTube version and not in the Framework version (we think!).
Hope you enjoy this work as much as we did.
Hi Tom,
That is a stunning film and a brlilliant lesson. I’ve always been a huge fan of using spreadsheets to handle and organise data. Using live forms adds another dimension – as well as making the data collection part of the exercise a snap. Good onya!!!!
Hope you sleep tonight. Thought I was the only one with crazy ideas (well powerful learning!!!??) ideas going through my head at that time of the morning. Like the idea though and will return to fill in the google forms. Just it is time to get tea now. Wonder what idea will come to you next so early in the morning!! Keep us informed. Some of the best ideas come then.
Wow! What a cool lesson. It can apply to either language arts or math and it is something that will keep the kids engaged in the movie and project! I love it. Thanks for writing about it. Get some sleep! 🙂